
The three most amazing charts on youth and crime you’ll see
For the last 50 years, “experts” and their politician and media disciples have been warning that America’s growing, racially diversifying young population (that is, more Latino and African Americans) would wreak all kinds of youthful havoc, led by crime, violence, drug abuse, street slaughter, juvenile superpredators, teenage psychopaths, and every kind of mayhem.*
What actually happened? California is the leading edge of demographic change:
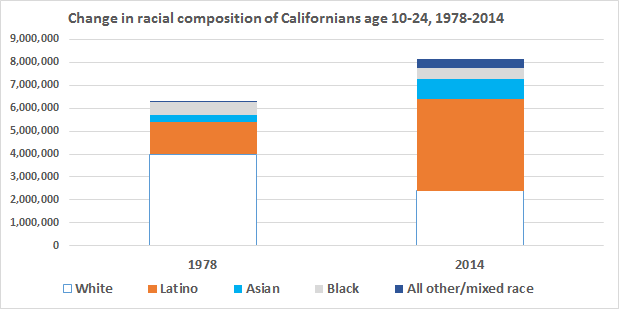
Source: Demographic Research Unit, California Department of Finance, Estimates, 2015.
Pretty straightforward. As California’s young population age 10-24 rose by 1.8 million over the last 35 years, the number of non-Latino Whites fell by 1.6 million, the number of Latinos rose by 2.6 million, and the proportion that is White fell from 63% to 29%. Couldn’t be more dramatic.
Here’s some more drama: the massively divided changes in felony rates by age:
Change in California felony rates by age group, 1978 (first year available) – 2014 (latest year)
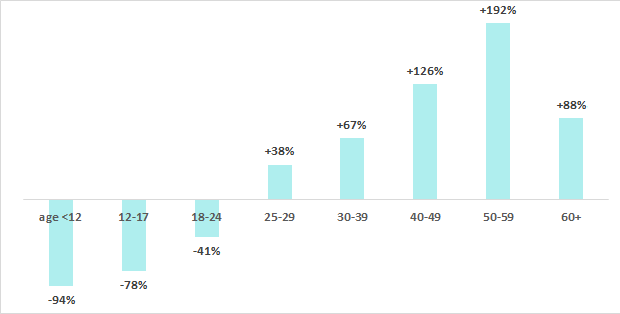
Source: California Criminal Justice Statistics Center, CSJS Statistics, Arrests, 2015.
Again, uncomplicated. Age groups under 25 (the dark demographic criminals) showed huge declines in crime led by children and youth, while older age groups (the whiter mature-brain groups) showed massive increases:
Now a complicated one showing crime rate trendlines by age group. For those who believe anything authorities and their media sycophants say about youth and adult crime, it’s worth close inspection:
Trends in California felony rates by age group, 1978-2014
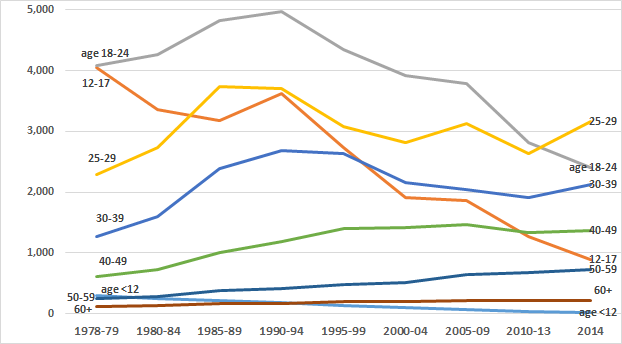
Source: California Criminal Justice Statistics Center, CSJS Statistics, Arrests, 2015.
Note several fascinating trends that authorities not only failed to predict, their theories and declarations insist they could not possibly have happened.
- Crime rates for teens age 12-17, the most crime-prone group in the late 1970s, fell below those of adults age 25-29 in the late 1980s, below those of adults in their 30s in the late 1990s, below adults in their 40s by around 2010, and are now approaching rates of adults in their 50s!
- Crime rates for another top-crime group in the 1970s, age 18-24, have now fallen below those of adults age 25-29 and are approaching those of 30-agers.
- Crime rates for preteen grade-school children, once more crime-prone than 50-agers, have fallen below those of their grandparents age 60 and older to the lowest crime levels of any age group.
These are cataclysmic, revolutionary trends in our largest, most rapidly diversifying state, which has proven a harbinger of crime trends nationwide. They are overturning every theory we have of crime, race, and age. Can authorities handle this kind of change and its implications? So far, no. (Mike Males)
——————————-
*Northeastern University criminologist and former Bureau of Justice Statistics authority James Alan Fox is recognized as America’s top expert even though he has never been even nearly right in 35 years of youth-terror crime forecasting. In the latest breathless forecast, a Crime & Delinquency paper so sloppy it never should have been published, Fox and University of Texas criminologist Alex Piquero based on “the age/race/gender composition of the population” (translation: the numbers of teenage and young-adult black and Latino males) predicted over 10,000 murderers age 14-24 per year by 2014. The actual number was less than half that.